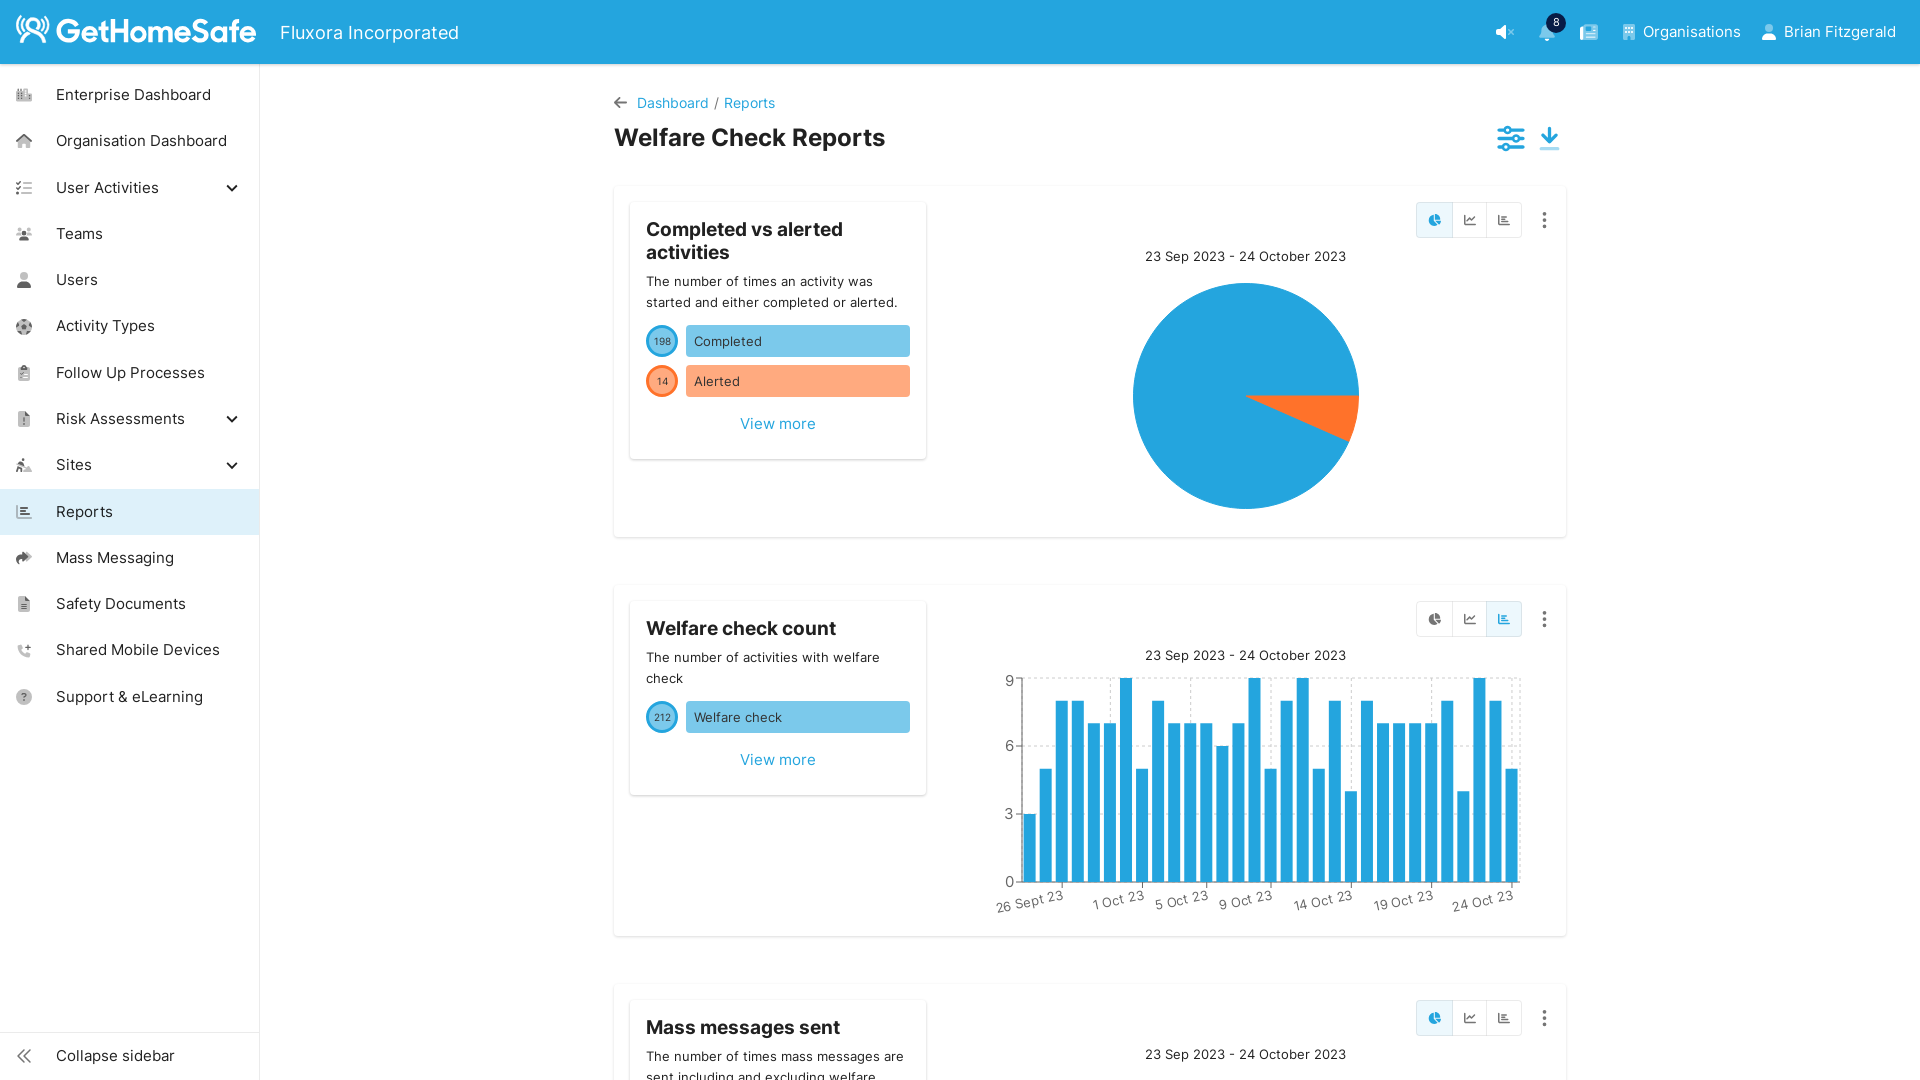
Reports are displayed using dynamic, interactive graphs—including pie charts, line graphs, and bar charts. Admins can expand individual reports to view detailed insights and customise the data shown. Reports are also available for download, allowing for deeper analysis or easy sharing.
Organisation admins can filter reports by team and generate reports for their own organisation. Enterprise admins have the ability to filter reports by organisation and access reporting across multiple organisations within their account.
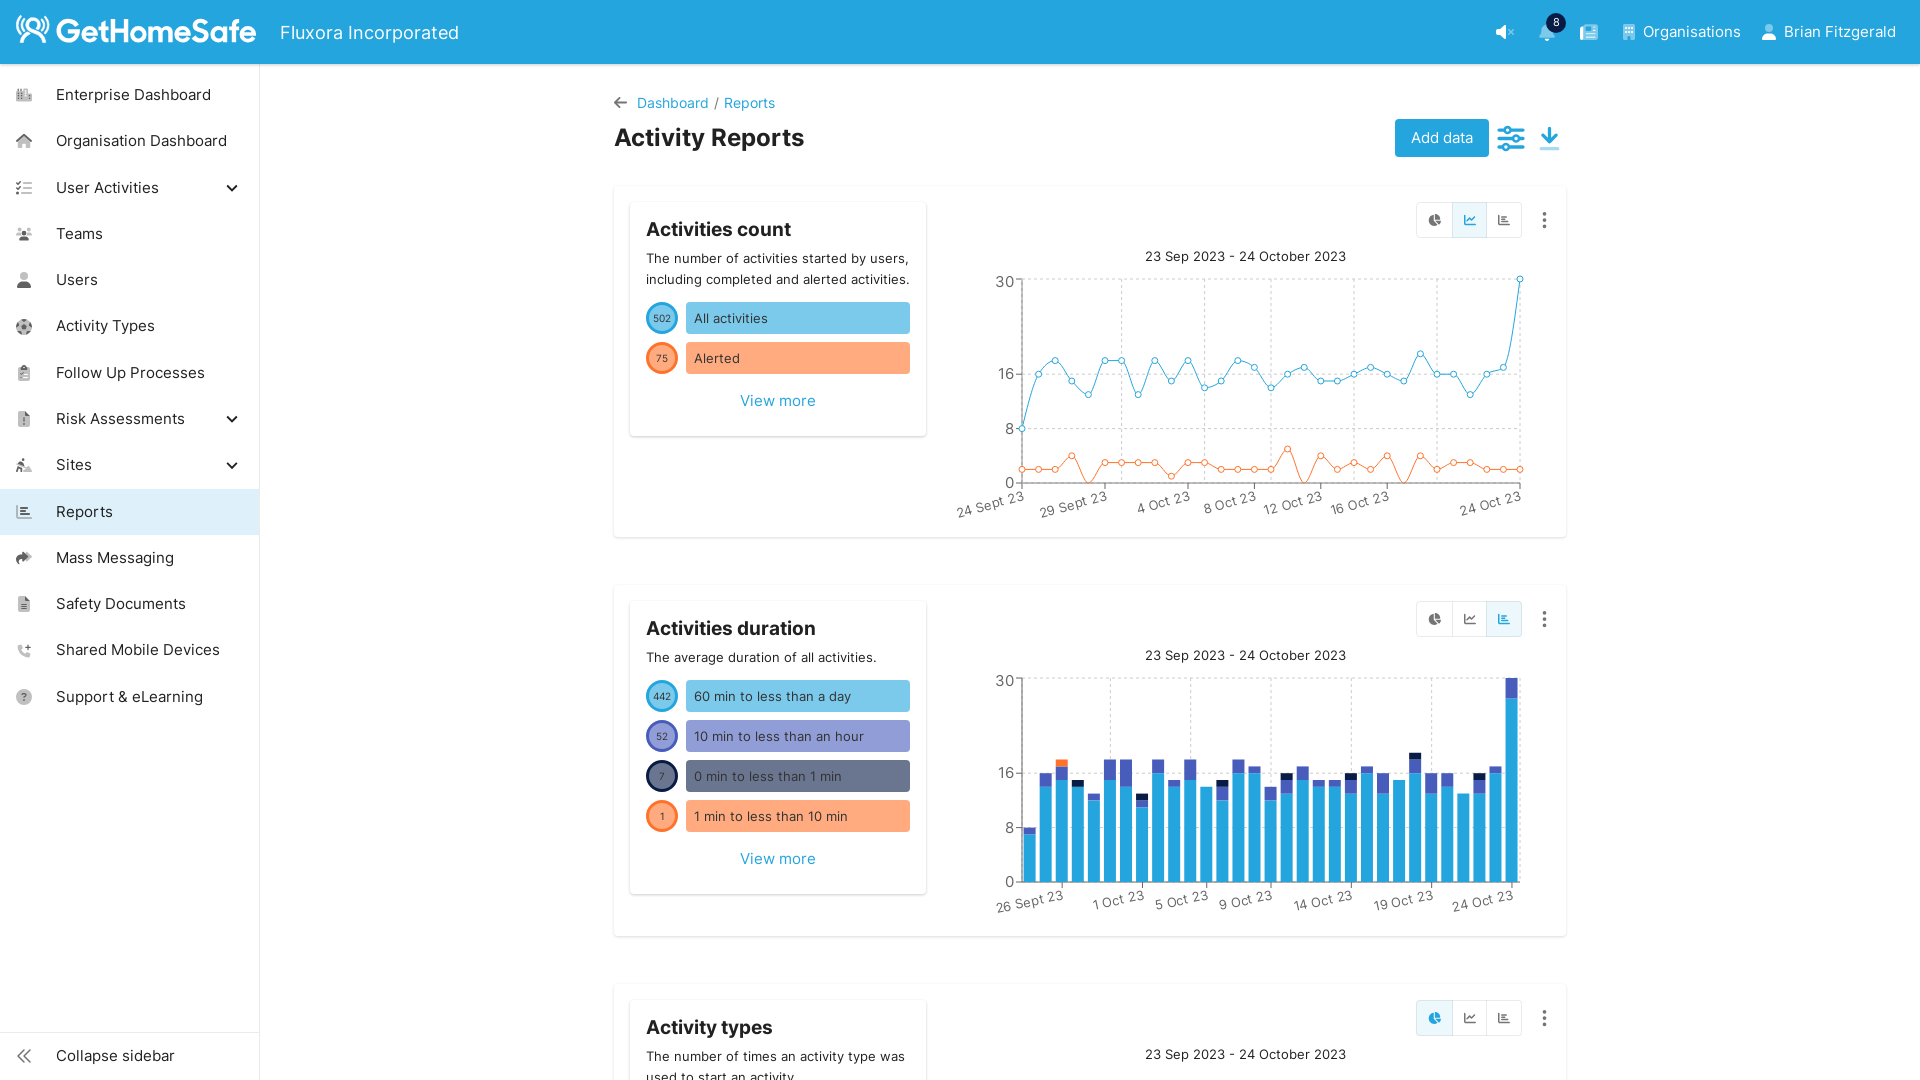
Activities
- Activities count
- Activities per team
- Activities duration
- Activity types
- Activity type categories
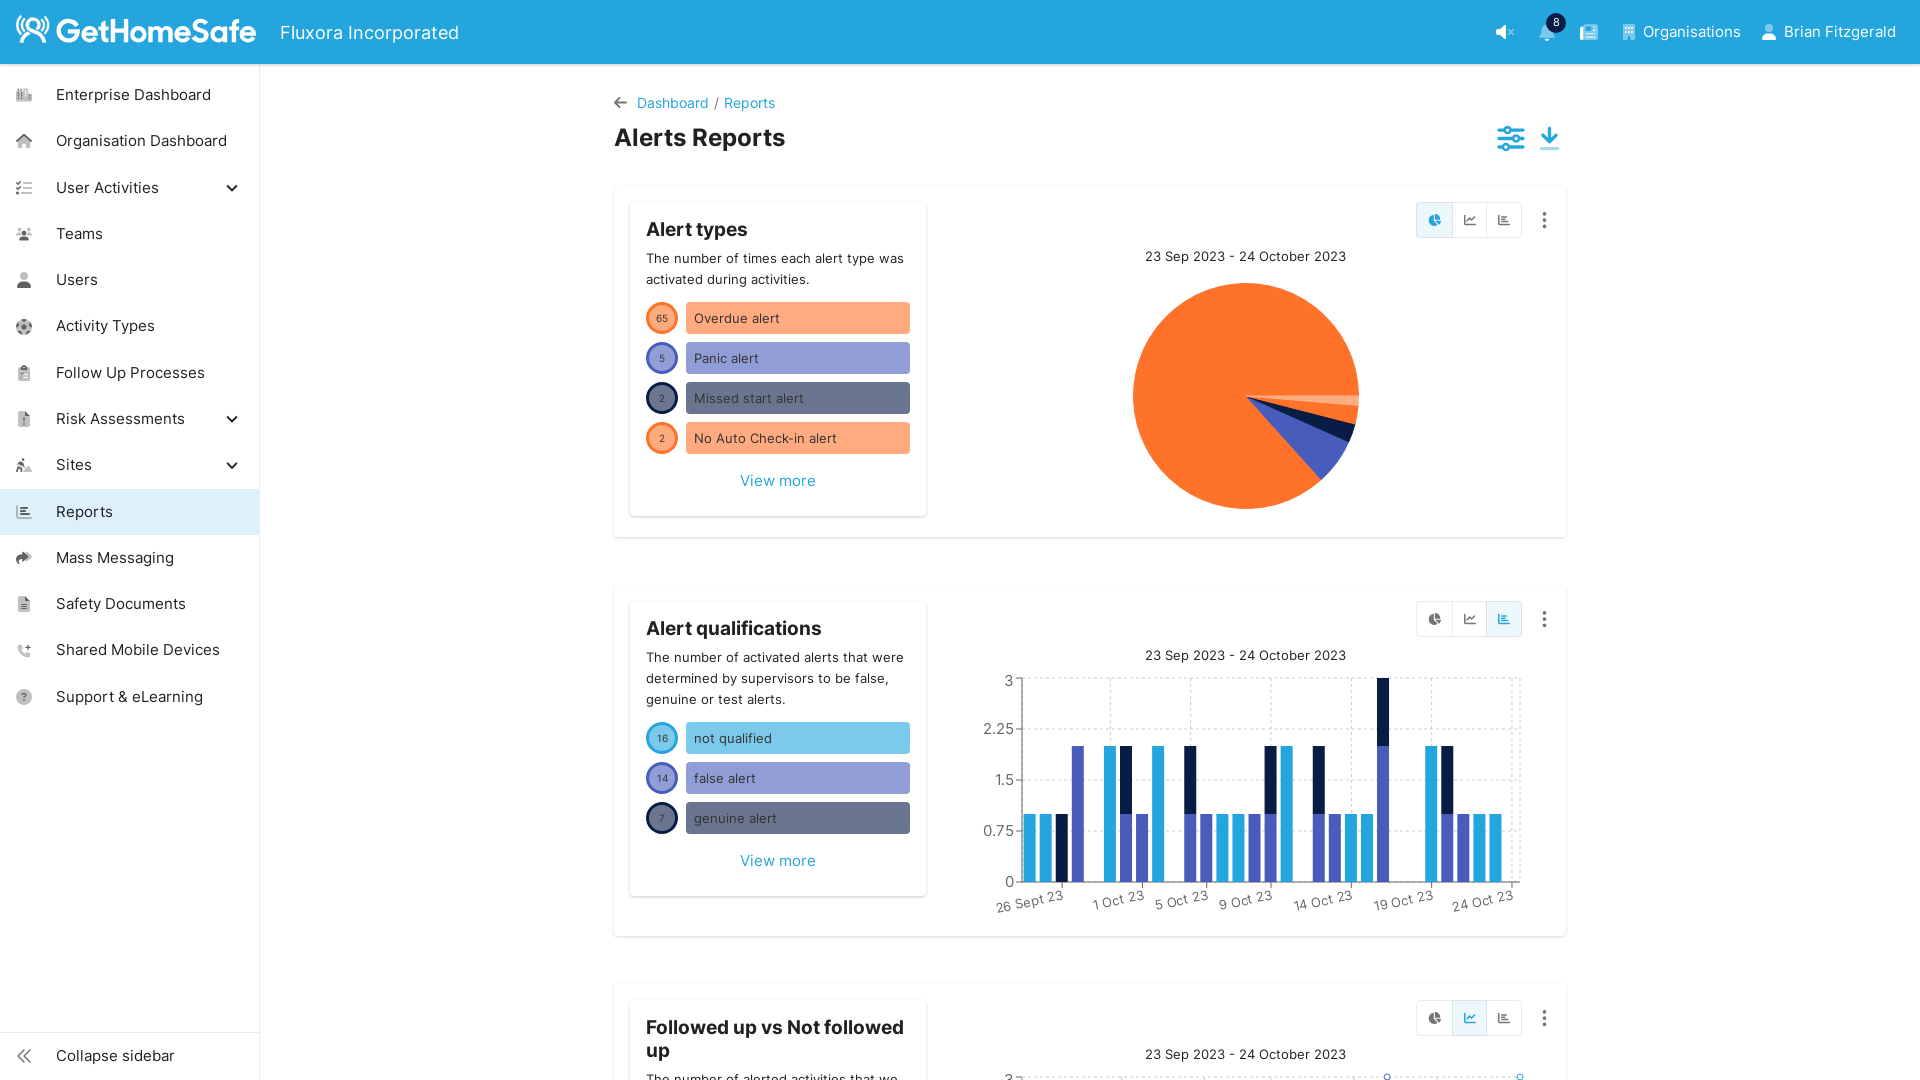
Alerts
- Alert types
- Alert classifications
- Followed-up vs not followed-up
- Average response time
- Average follow-up time
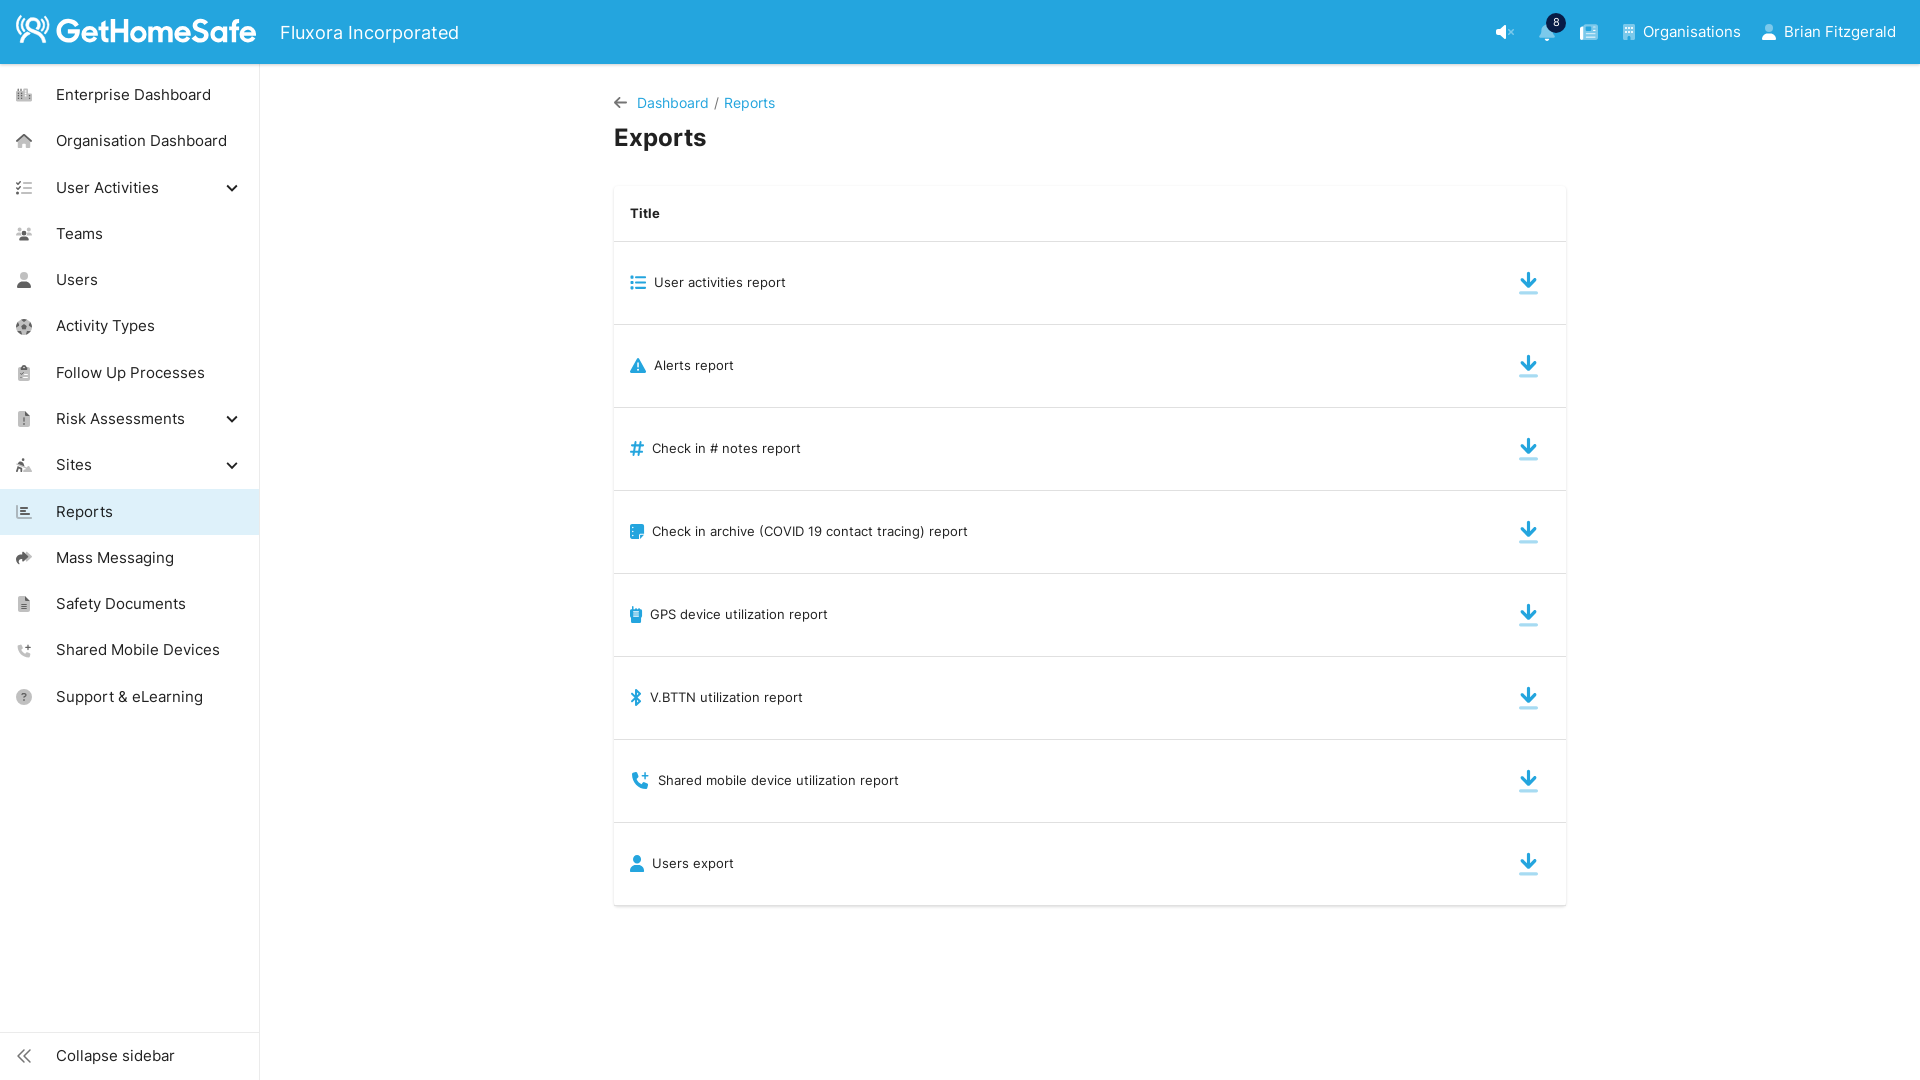
Exports
Download reports in .csv format. For more information check out the following article: .CSV Exports
- User activities report (Called Enterprise activities report for Enterprise admins)
- Alerts report (Called Enterprise alerts report for Enterprise admins)
- Check-in # notes report
- Check in archive report
- GPS device utilization report
- Bluetooth button utilisation report
- Shared mobile devices utilisation report
- Users export
- Billing report
- Time and mileage report
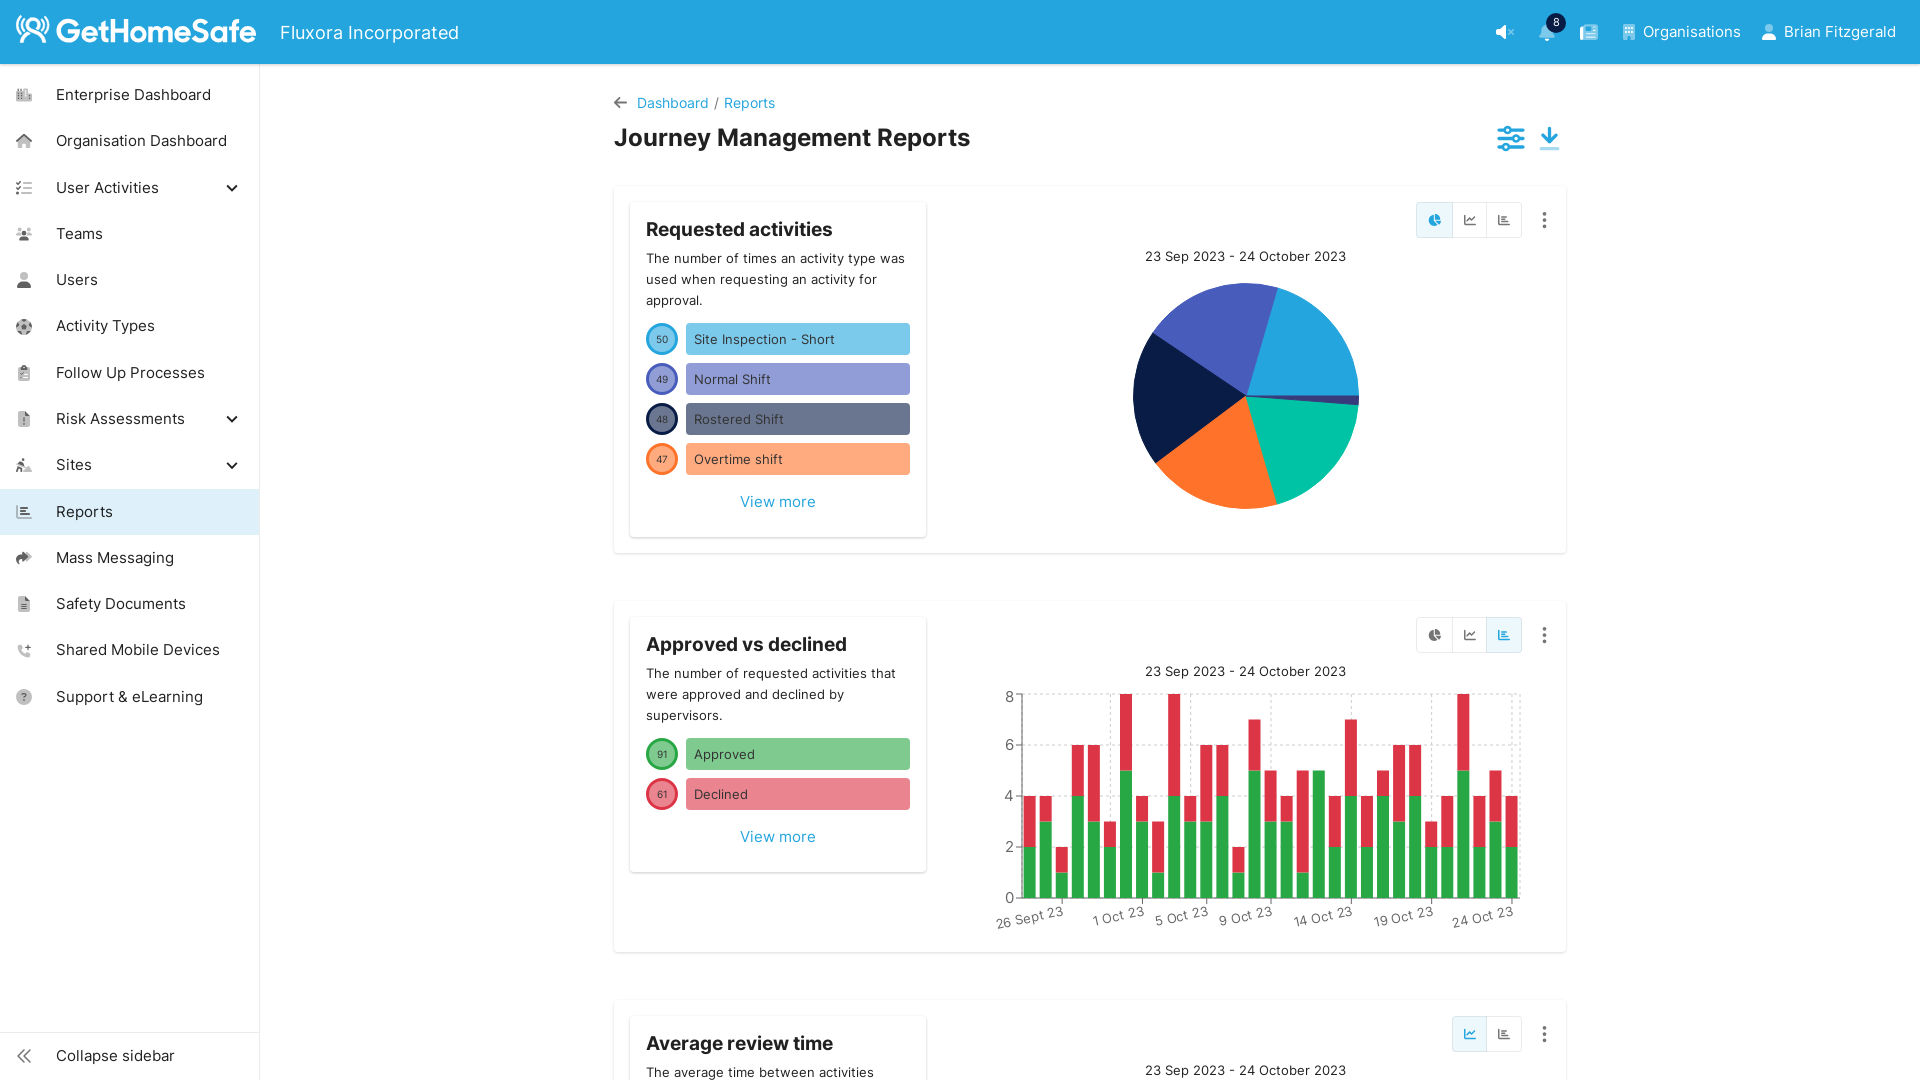
Journey Management
- Requested activities
- Approved vs declined
- Average review time
- Completed vs alerted activities
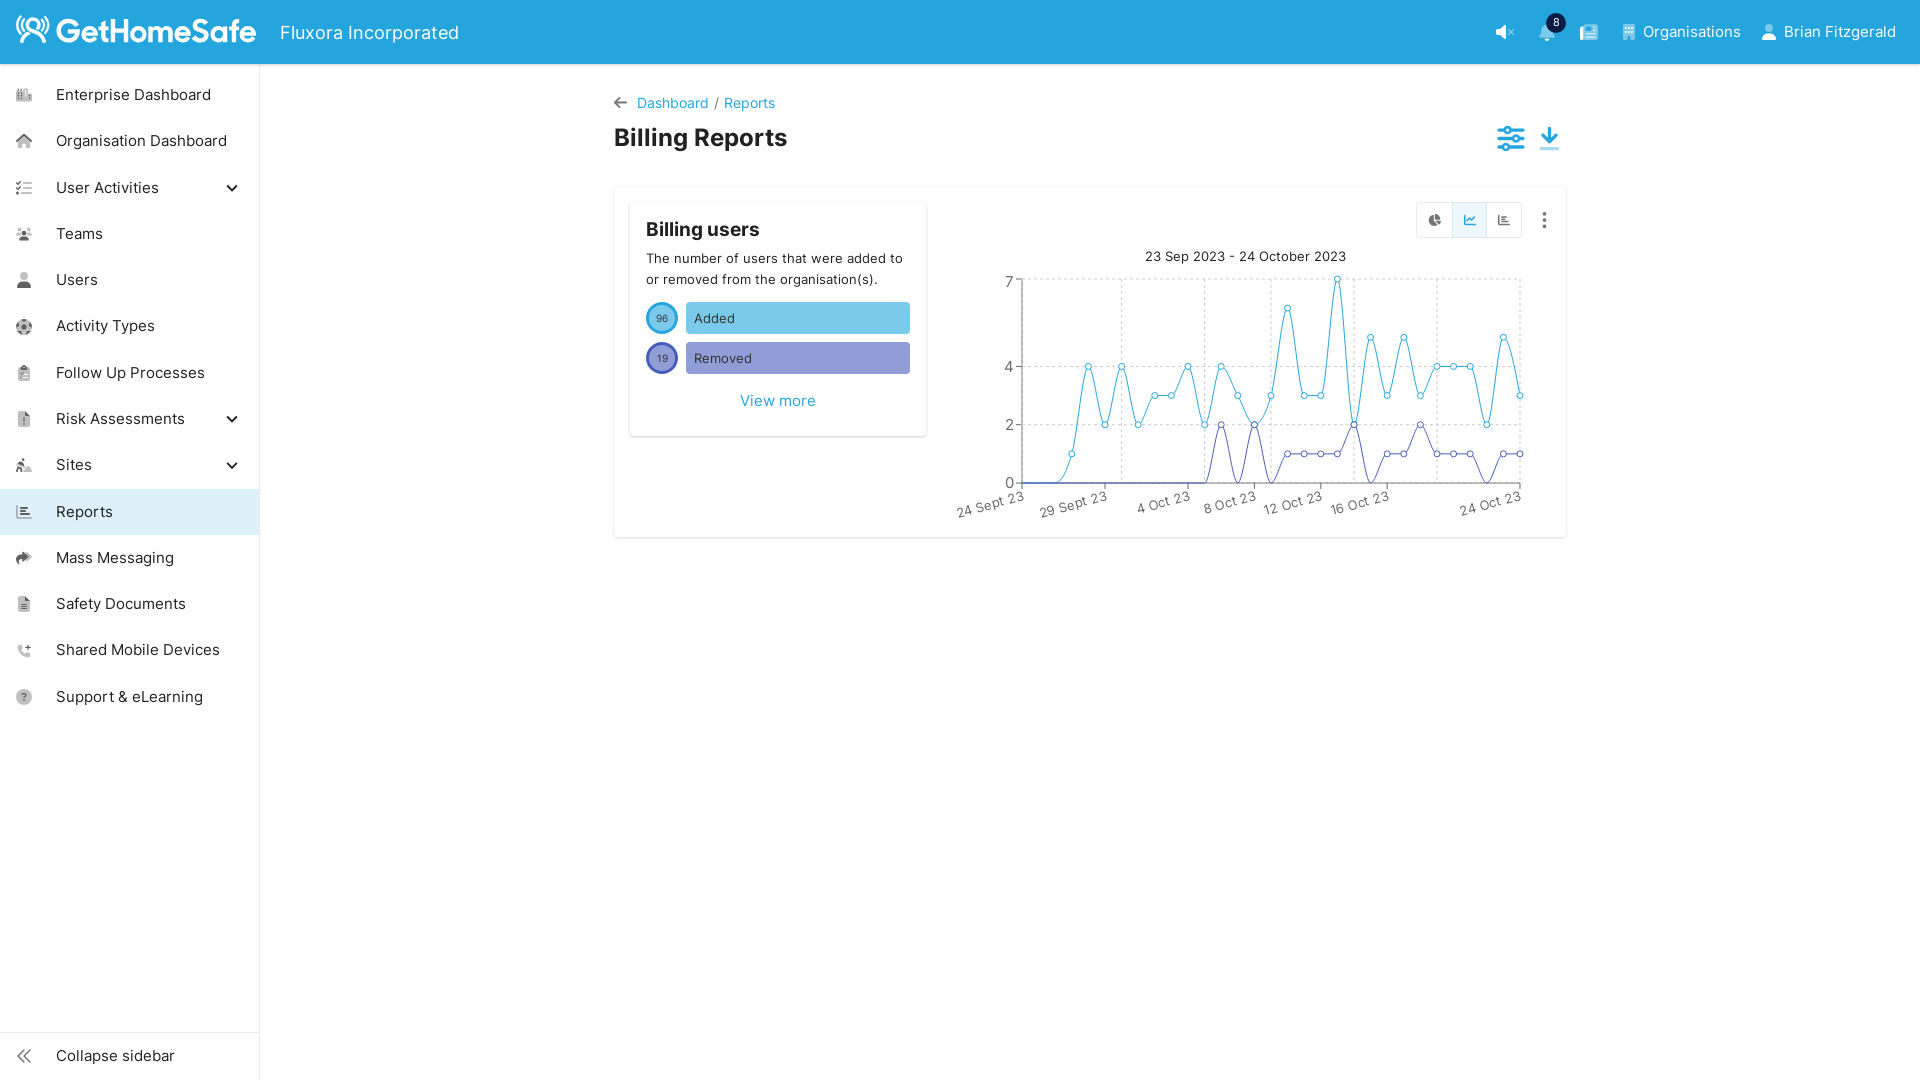
Billing
- Billing users
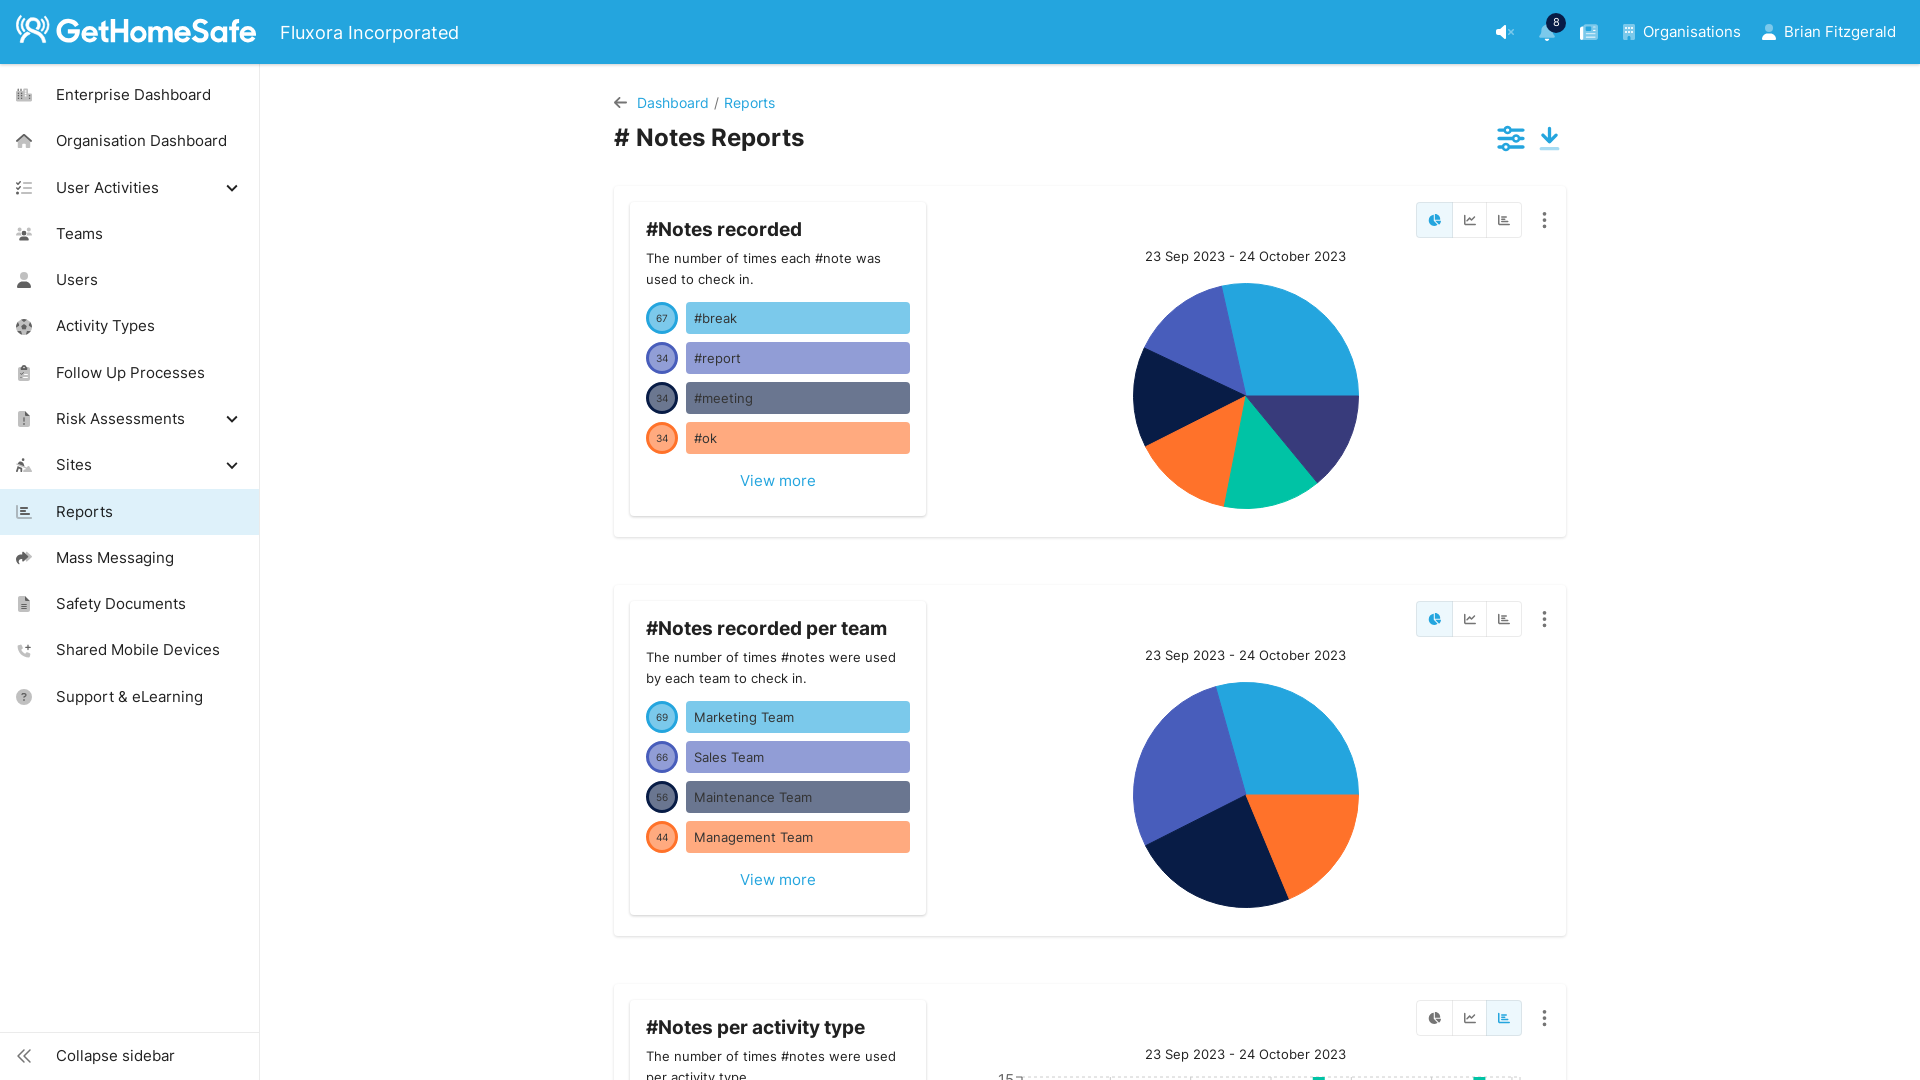
#Notes
- #Notes recorded
- #Notes recorded per team
- #Notes per activity type
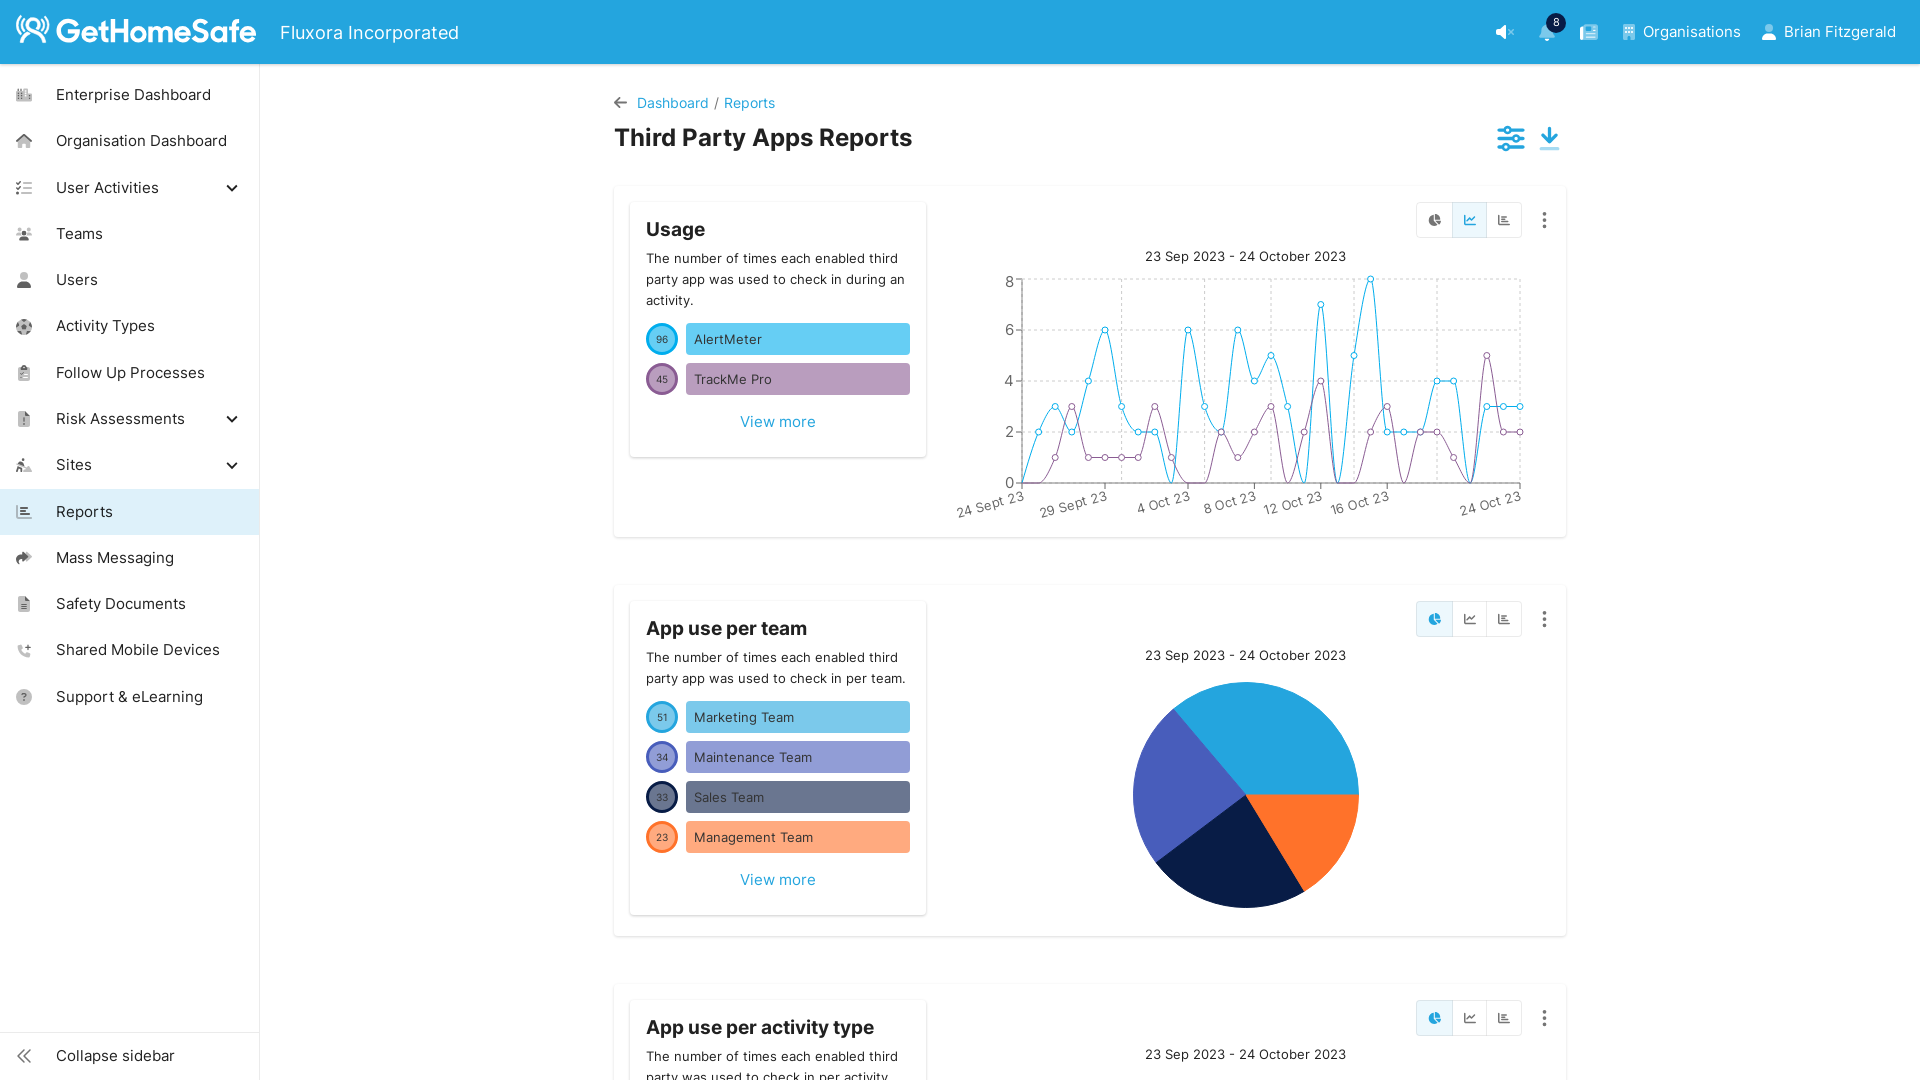
Third Party Apps
- Usage
- App use per team
- App use per activity type
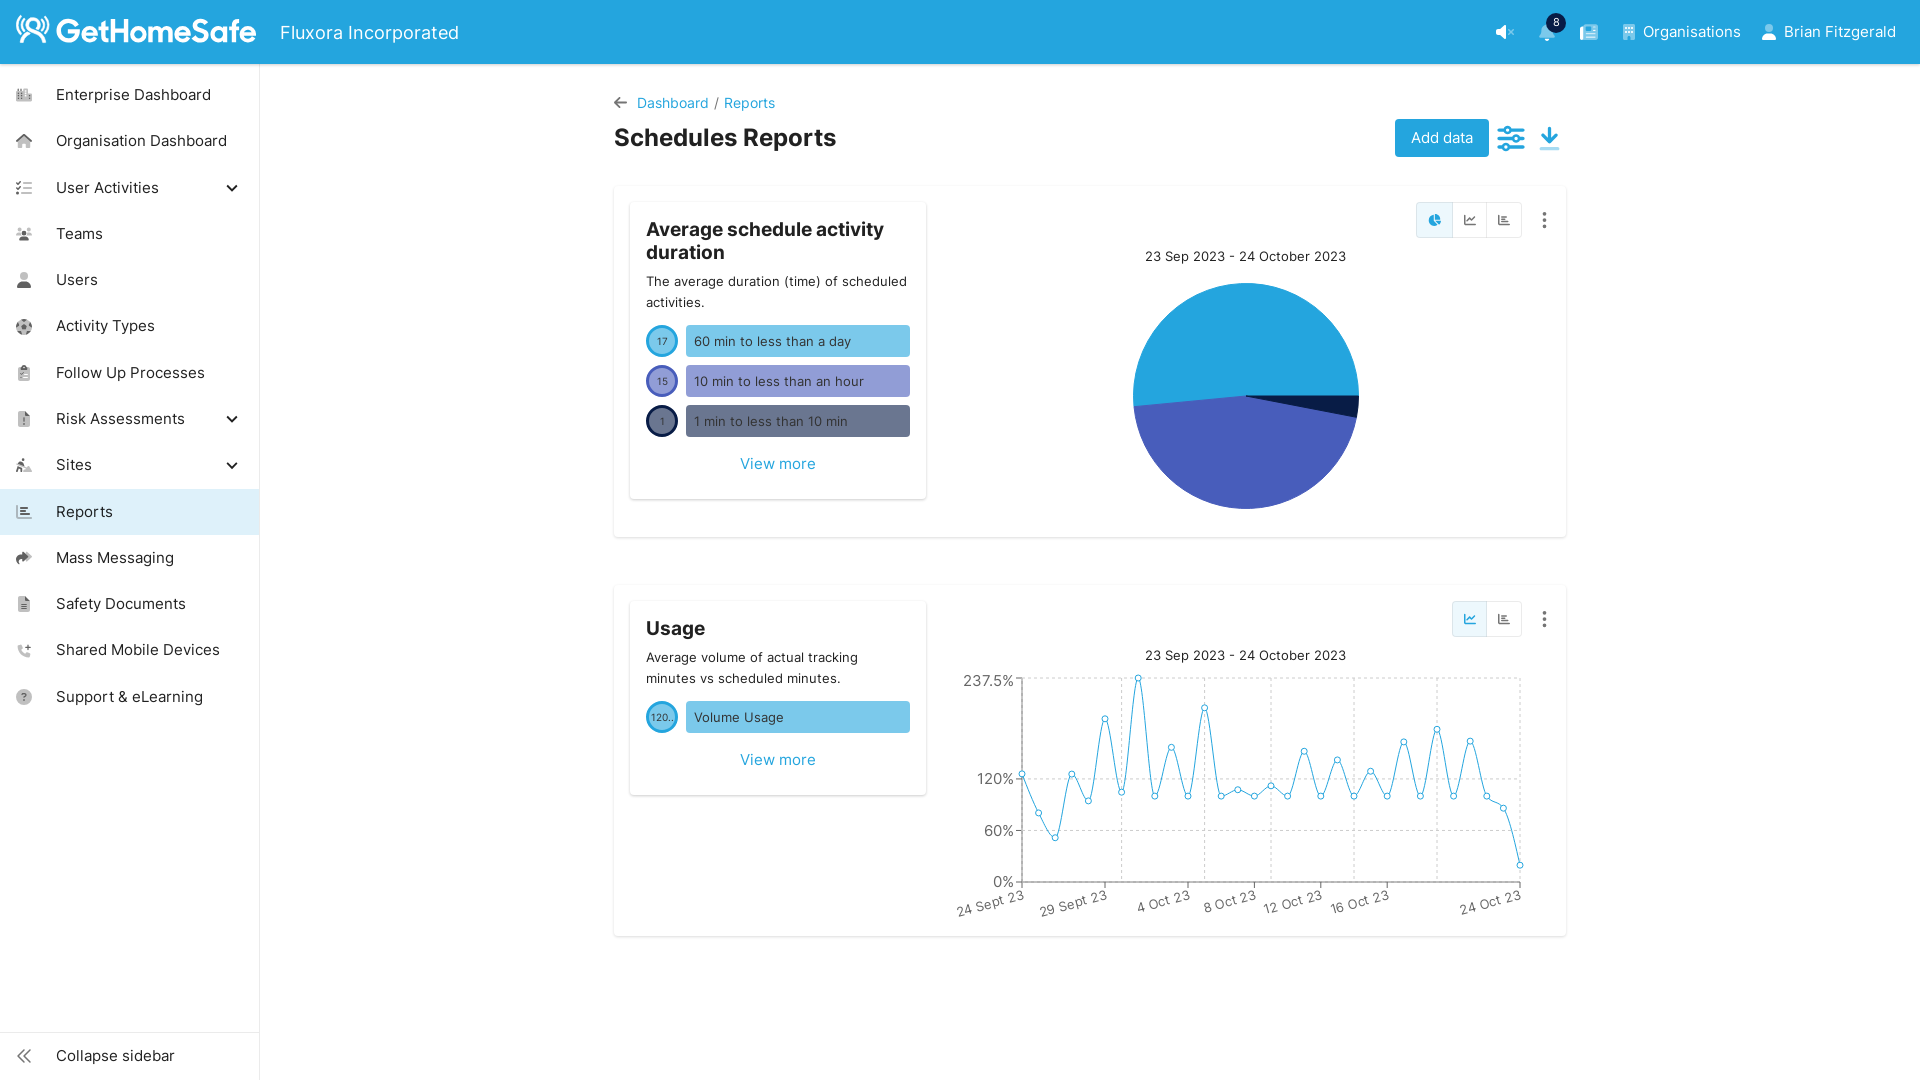
Schedules
- Schedule activity count
- Schedule per team
- Average schedule activity duration
- Activities started late
- Missed started count
- Usage
Sites (visible with the Fieldworker add-on)
- Average time per site
- Activities per site
- Total visits per site
- Sites visited per team
- Alerts per site
Welfare Check
- Completed vs alerted activities
- Welfare check count
- Mass messages sent
- Average welfare check complete time